Programming with Matlab
Customed TickLabel function
XTickLabel et YTickLabel don't accept Latex
commands.
One have to cope, for instance with
text command
which enable writting text wherever desired inside a figure, and which
accept Latex…
text(x,y,str)where
x and y are coordinates where to put the
text (according to the current scale, cf. axis),
and str is the text itself (string).
Avantage is that Latex can be freely used (and also many other things, see
help text):
text(x,y,str,'interpreter','LaTex');text function.
It then remains to replace Matlab defaut labels with ours, correctly located in the figure.
Following scripts, two functions, X&Y TickLabel, and a testing script, do that.
Fonction XTickLabel
%%%%%%%%%%%%%%%%%%%%%%%%%%%%%%%%%%%%%%%%%%%%%%%%%%%%%%%%%%%%%
% XTickLabel function:                                      %
%  create labels on x axis, accepting Latex commands        %
%                                                           %
%   Created by Y. Morel,                                    %
%   https://xymaths.fr/EN/Matlab/                       %
%                                                           %
% Use: XTickLabel(XTL,XTLpos,f)                             %
%   XTL={'str1' 'str2' 'str3' ...};                         %
%      labels, as strings                                   %
%   XTLpos=[x1 x2 x3 ...];                                  %
%       locations on x axis: xi is the location for stri    %
%   f: number of the figure on which labels are to be write %
%%%%%%%%%%%%%%%%%%%%%%%%%%%%%%%%%%%%%%%%%%%%%%%%%%%%%%%%%%%%%
function XTickLabel(XTL,XTLpos,f)
ax=axis;
xliminf=ax(1);xlimsup=ax(2);
yliminf=ax(3);ylimsup=ax(4);
axis([xliminf xlimsup yliminf ylimsup]);


set(get(f,'CurrentAxes'),'XTick',0:3)

NXTL=length(XTL);
%XTLpos=xliminf:(xlimsup-xliminf)/(NXTL-1):xlimsup;

set(get(f,'currentaxes'),'xticklabel',[])

% Label locations, under x axis
ypos=yliminf-(ylimsup-yliminf)/30;

for ii=1:NXTL
    text(XTLpos(ii),ypos,XTL{ii},...
          'interpreter','latex','fontsize',14)
end

set(get(f,'CurrentAxes'),...
          'XTick',...
          xliminf:(xlimsup-xliminf)/NXTL:xlimsup);

set(get(f,'currentaxes'),'xtick',XTLpos)

end
and same for
YTickLabel.m:
Fonction YTickLabel
%%%%%%%%%%%%%%%%%%%%%%%%%%%%%%%%%%%%%%%%%%%%%%%%%%%%%%%%%%%%%
% YTickLabel function:                                      %
%  create labels on y axis, accepting Latex commands        %
%                                                           %
%   Created by Y. Morel,                                    %
%   https://xymaths.fr/EN/Matlab/                       %
%                                                           %
% Use: YTickLabel(YTL,YTLpos,f)                             %
%   YTL={'str1' 'str2' 'str3' ...};                         %
%      labels, as strings                                   %
%   YTLpos=[x1 x2 x3 ...];                                  %
%       locations on y axis: yi is the location for stri    %
%   f: number of the figure on which labels are to be write %
%%%%%%%%%%%%%%%%%%%%%%%%%%%%%%%%%%%%%%%%%%%%%%%%%%%%%%%%%%%%%
function YTickLabel(YTL,YTLpos,f)

ax=axis;
xliminf=ax(1);xlimsup=ax(2);
yliminf=ax(3);ylimsup=ax(4);
axis([xliminf xlimsup yliminf ylimsup]);


set(get(f,'CurrentAxes'),'YTick',0:3)

NYTL=length(YTL);
%YTLpos=yliminf:(ylimsup-yliminf)/(NYTL-1):ylimsup;

set(get(f,'currentaxes'),'yticklabel',[])

% Label locations
ypos=xliminf-(xlimsup-xliminf)/10;

for ii=1:NYTL
    text(ypos,YTLpos(ii),YTL{ii},...
        'interpreter','latex','fontsize',14)
end

set(get(f,'CurrentAxes'),...
        'YTick',...
        yliminf:(ylimsup-yliminf)/NYTL:ylimsup);

set(get(f,'currentaxes'),'ytick',YTLpos)

end
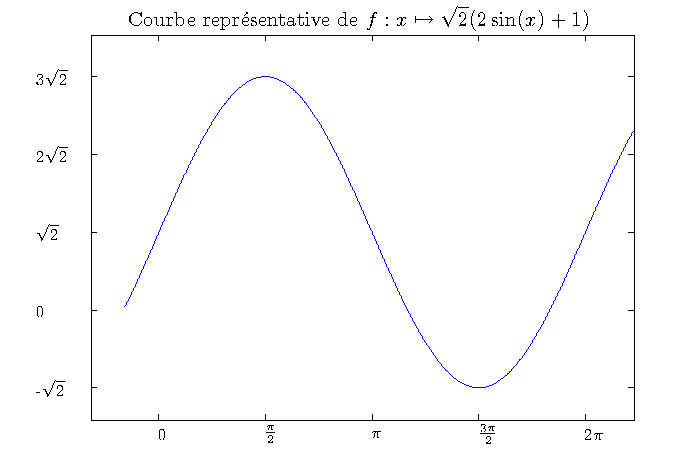
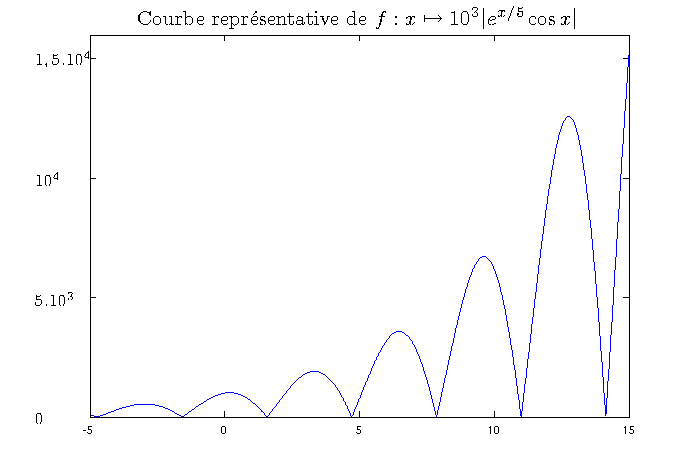
Example of script using these functions is given below, yelding the figures:


by calling functions
XTickLabel & YTickLabel:
Script test_XYLabel.m
clear all;close all;
%% 1er exemple:
figure(10),clf,whitebg('w')

x=-0.5:0.01:7;
y=sqrt(2)*(2*sin(x)+1);

plot(x,y);
%axis([-0.5 7 -2 5]);   % Axis can be limited, or not


XTL={'0' '$\frac{\pi}{2}$' '$\pi$' '$\frac{3\pi}{2}$' '$2\pi$'};
XTLpos=[0 pi/2 pi 3*pi/2 2*pi];
XTickLabel(XTL,XTLpos,10);

YTL={'-$\sqrt{2}$' '0' '$\sqrt{2}$' '$2\sqrt{2}$' '$3\sqrt{2}$'};
YTLpos=[-sqrt(2) 0 sqrt(2) 2*sqrt(2) 3*sqrt(2)];
YTickLabel(YTL,YTLpos,10)

TITLE='Courbe repr\''esentative de $f:x\mapsto \sqrt{2}(2\sin(x)+1)$';
title(TITLE,'interpreter','latex','fontsize',18);

%% 2eme exemple:
figure(11),clf,whitebg('w')

x=-5:0.01:15;
y=1e3*cos(x).*exp(x/5);y=abs(y);

plot(x,y);

YTL={'0' '$5.10^3$' '$10^{4}$' '$1,5.10^{4}$'};
YTLpos=[0 5e3 1e4 1.5e4];
YTickLabel(YTL,YTLpos,11)


TITLE='Courbe repr\''esentative de $f:x\mapsto 10^3|e^{x/5}\cos x |$';
title(TITLE,'interpreter','latex','fontsize',18)